Visitor Analytics
Administrators can view visitor analytics by going to Visitors > Analytics menu.
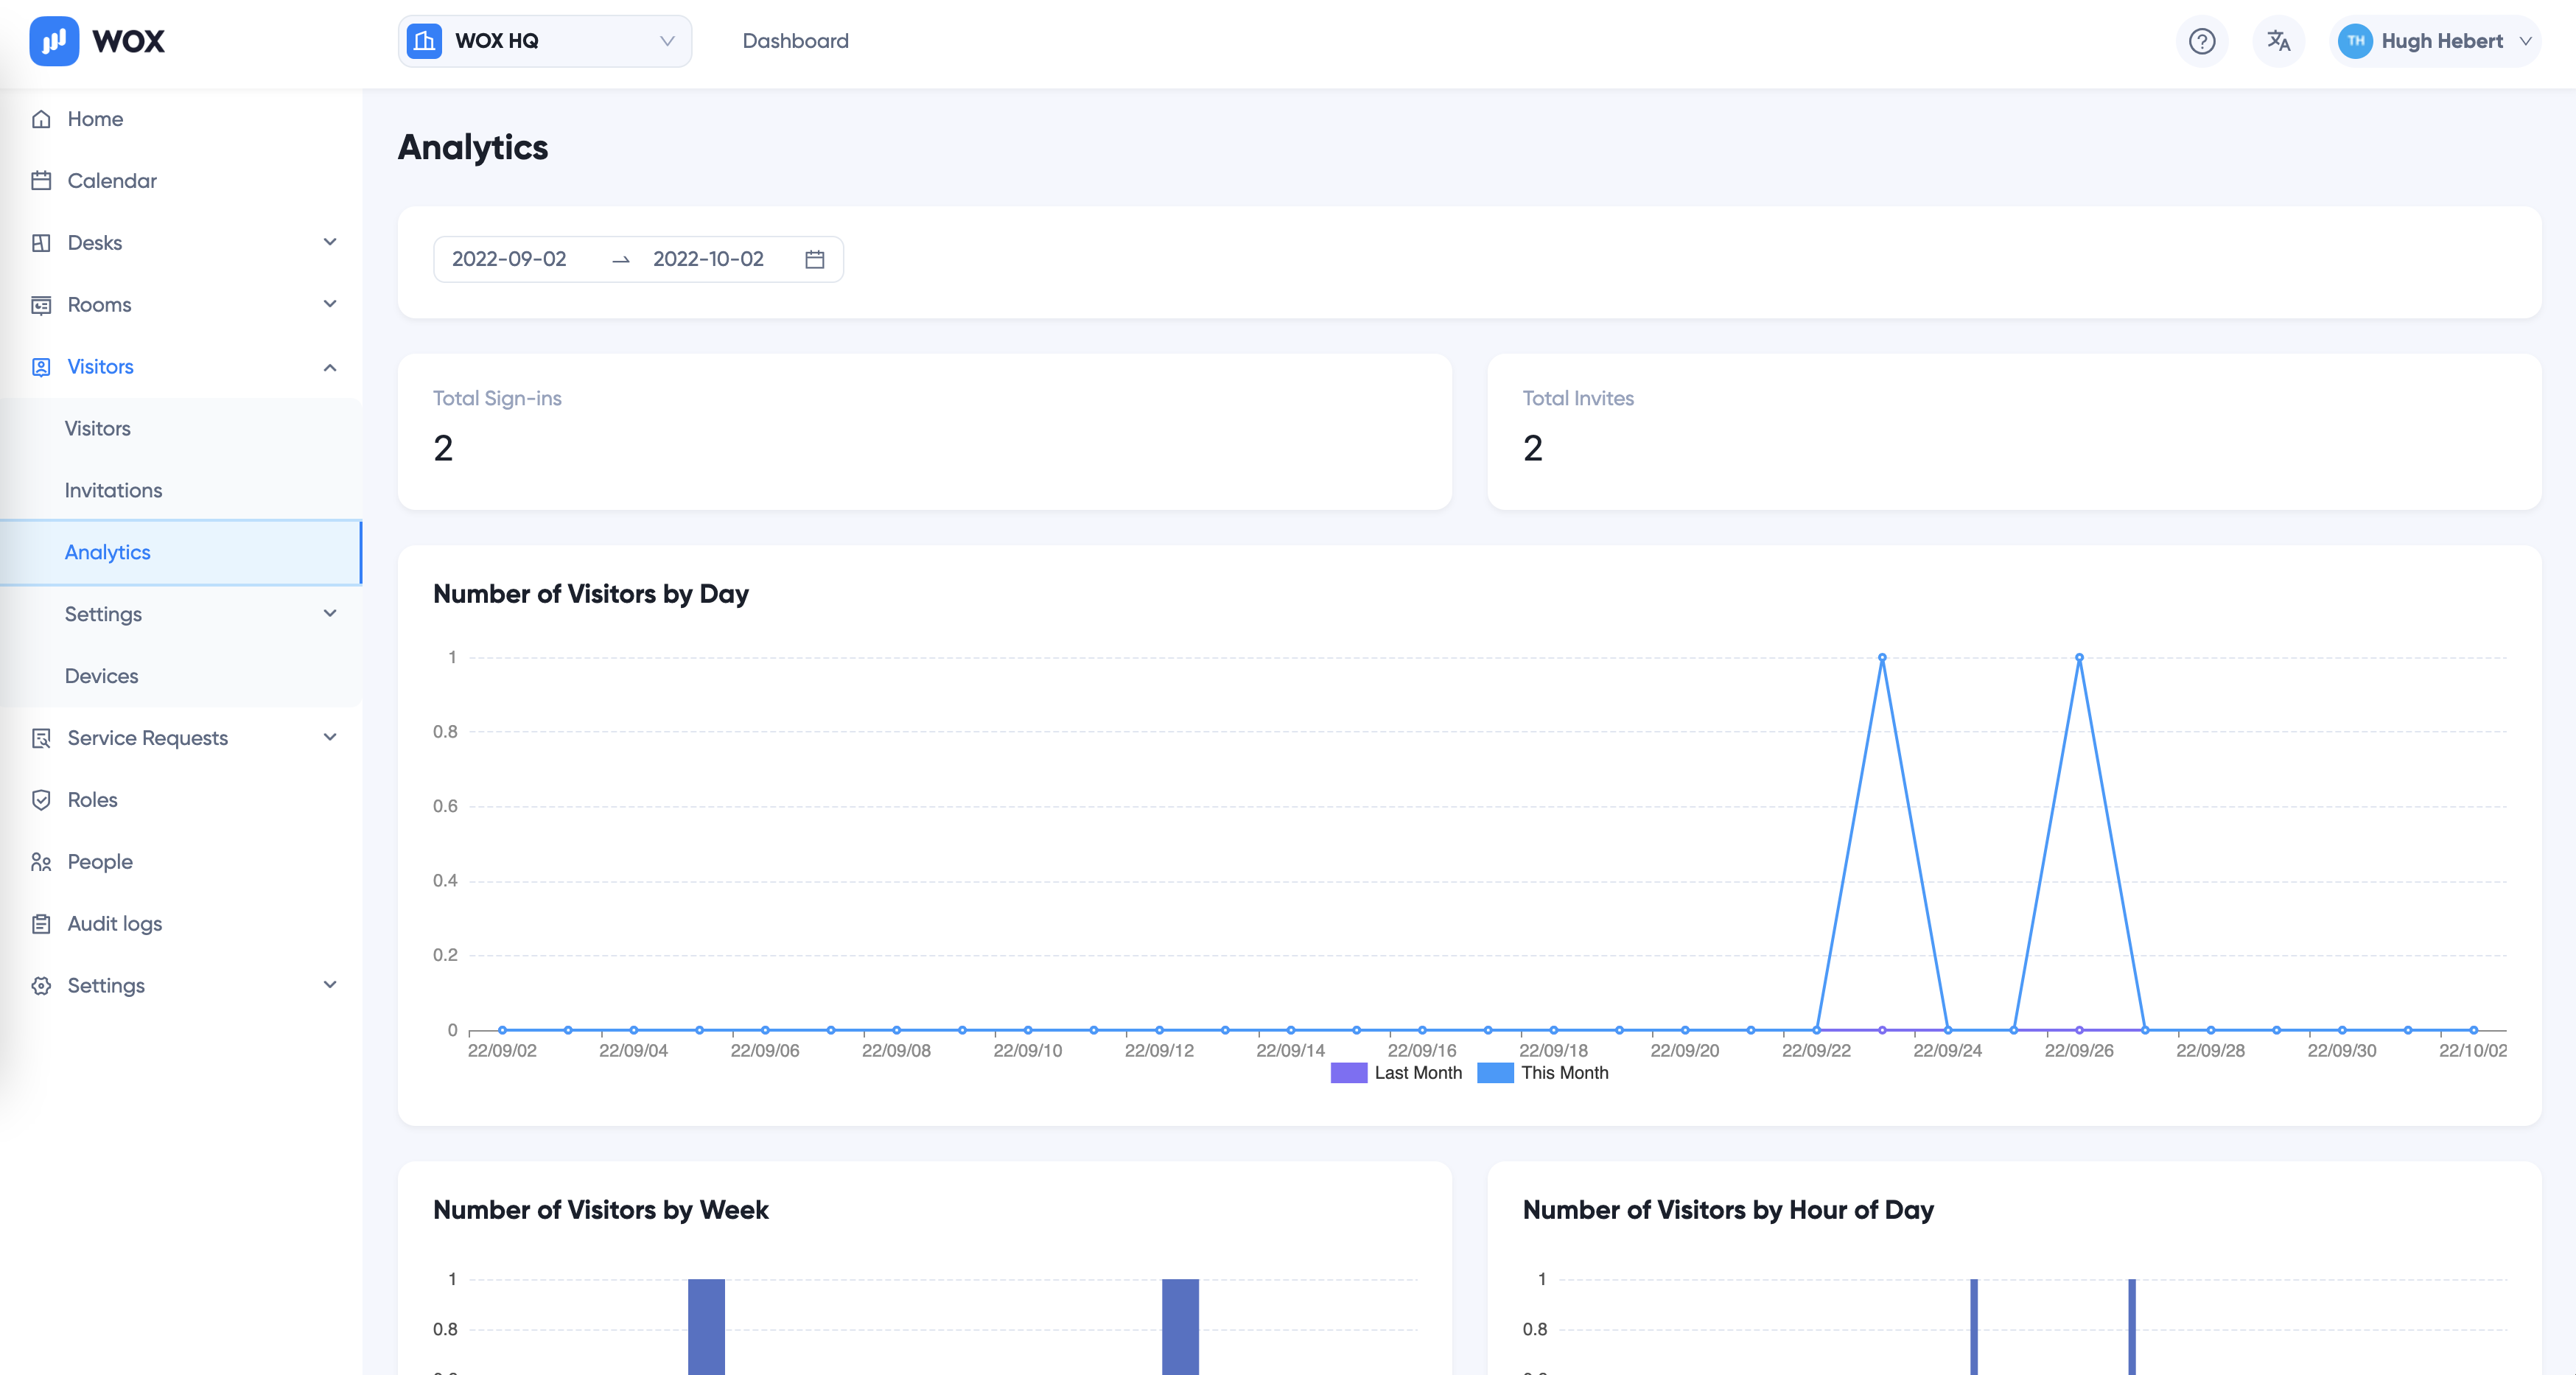
On top of the page, select the time range to report. By default it is last 30 days.
Totals
Totals displays Total sign-ins and Total invites during the time frame.
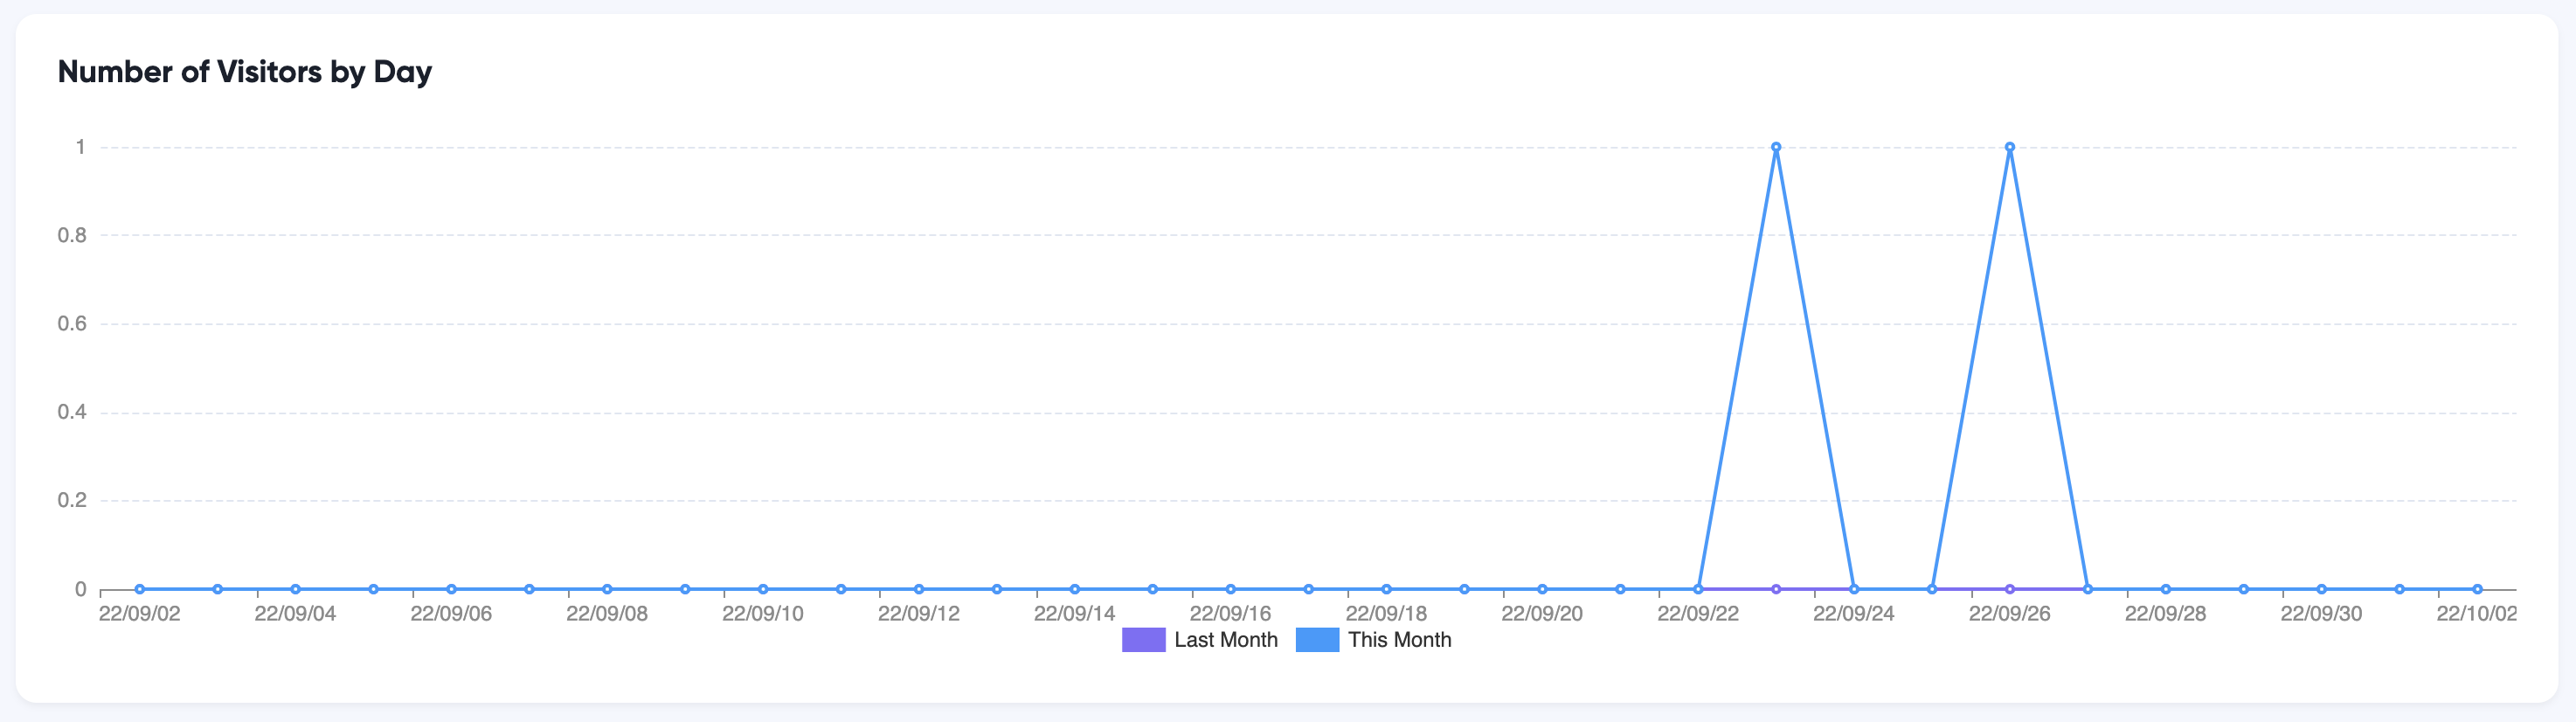
Number of Visitors
A chart displaying the number of visitors on each day for the time frame and compare with last month.
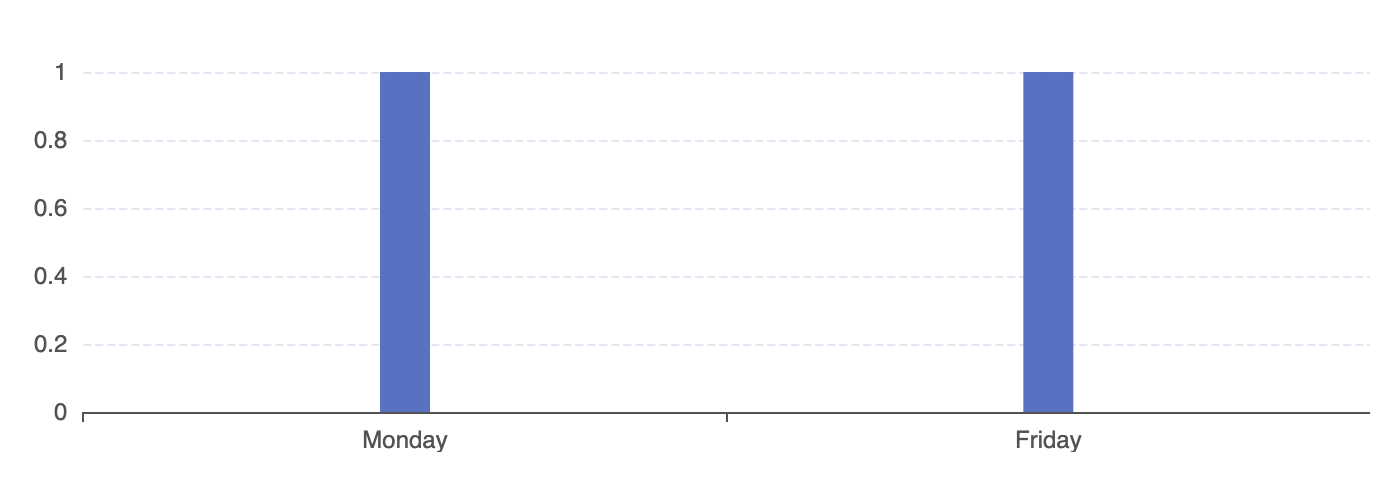
Number of Visitors by Weekday
Group visitors by weekday and calculate the average number of visitors. Tells on which day most or fewest visitors come to workplace.
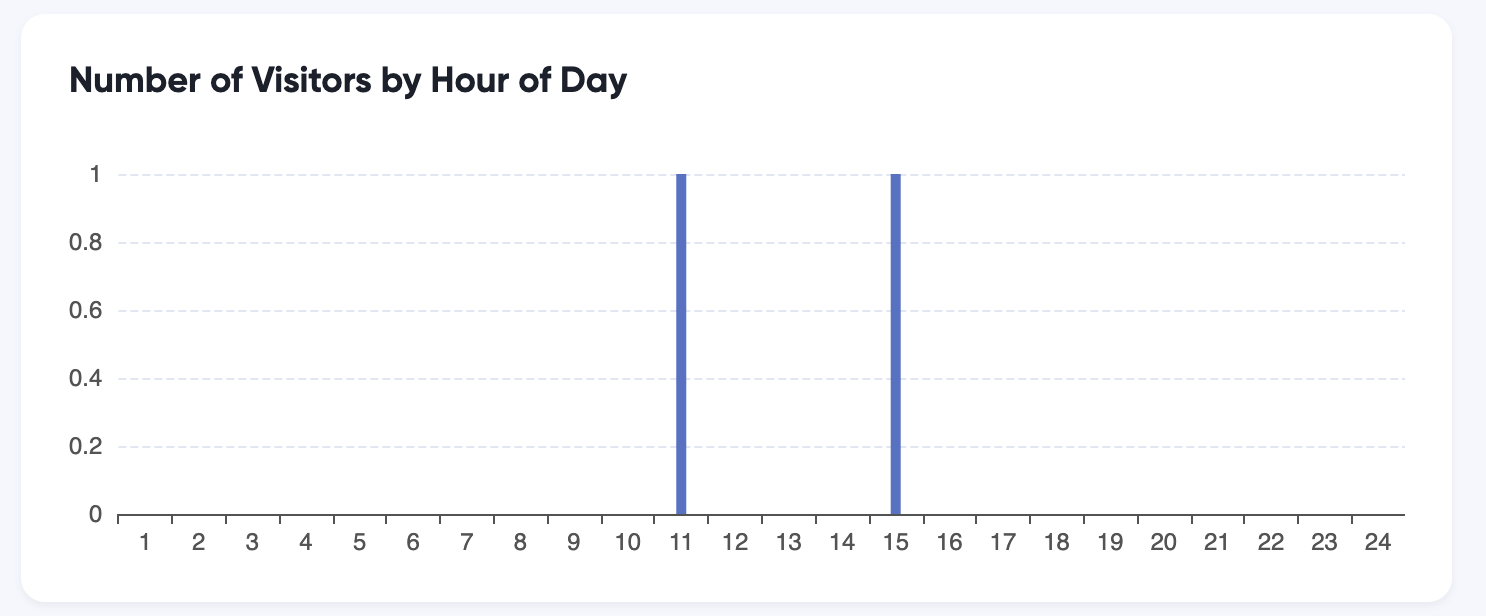
Number of Visitors by Hour of day
Group visitors by number of hours and calculate the average number of visitors. Tells on which hour on each day most or fewest visitors come to workplace.
Number of Visitors by Hour of Weekday
Group visitors by hours and weekday and calculate the average number of visitors.
Most Visited Departments
Tells which departments have the most visitors
Most Visited Users
Tells which users have the most visitors
By Request Types
Tells how visitors are invited
By Visitor Types
Tells percentage of types of visitors